
Not All Content Contributes Equally to Machine Confidence
Take a sheet of paper and list every major content block on your website. Your homepage copy. Your about page. Your case studies. Your product descriptions. Your blog posts. Your whitepapers. Your testimonials.
Now ask yourself one question about each block: can a machine verify this claim independently? What you will find is that most B2B websites are carrying a lot of content that a machine cannot verify, and not enough content that it can. The distribution tells you exactly why AI systems either trust your company or do not.
We call this concept Evidence Strength. It is one of the factors behind the Clarity Index. Here is how to think about it on your own site, today, in about thirty minutes.
The Evidence Strength Tiers
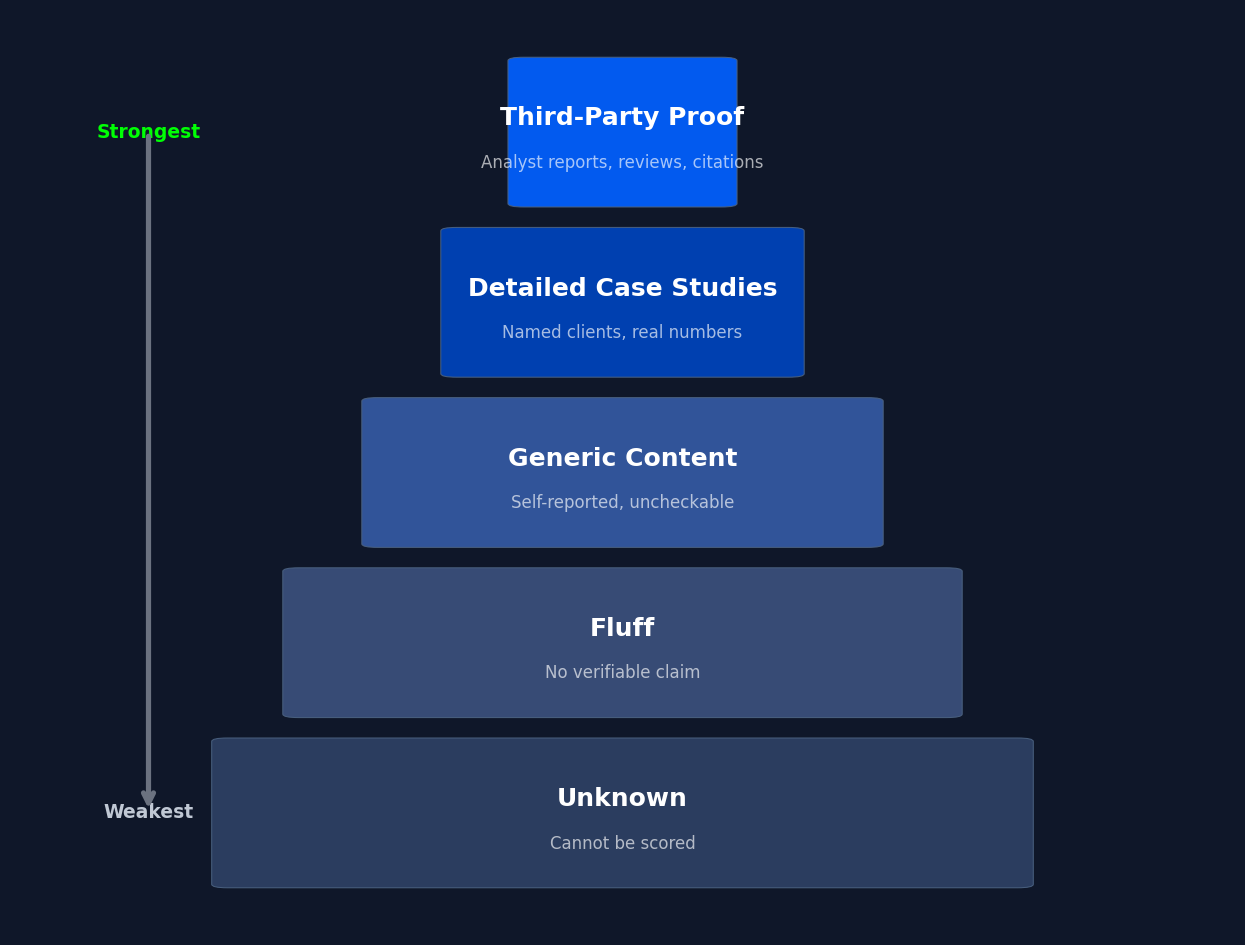
There are four tiers of evidence, from strongest to weakest.
Third-party proof is independent validation you did not produce. Forrester or Gartner reports that mention your company. Academic citations. Video testimonials with named people at named companies. Industry analyst endorsements. Published reviews in trade publications. This is the strongest tier because the source has no incentive to inflate your claims. A [machine trust]s independent verification more than self-reporting.
Detailed case studies are first-party content, but specific enough to check. Named clients. Documented outcomes. Real numbers. Verifiable timelines. “We helped Midwest Fabrication reduce scrap rates by 23% over four months by implementing our real-time monitoring system” is strong evidence. It is your content, but a determined person can verify the claim by calling Midwest Fabrication.
Generic content is self-reported, general, uncheckable. Blog posts about industry trends. Capability descriptions without specifics. “Our team brings decades of experience” type copy. “About us” pages that describe culture without evidence. This content fills space but validates nothing a machine can cite with confidence. It is not useless for humans. For machine trust, it is nearly inert.
Fluff is content that makes no verifiable claim at all. “We help companies work faster.” “Passionate about delivering results.” “Your trusted partner.” These sentences cannot be counted as evidence because there is nothing in them to verify. They consume bandwidth and dilute your signal.
Unknown / Unverifiable is a separate category for claims that cannot be scored either way. A certification badge with no verification link. A partnership mention with no corroboration. An award with no issuing body named. These are question marks. Question marks are worse than fluff because a machine has to guess, and guessing reduces confidence.
A Real Audit Shows Where Most Sites Fall Short
Let us walk through a typical mid-size B2B manufacturing company’s website. We will call them SteelTech. They make custom steel fabrication equipment. About 120 employees. Solid company. Average website.
Homepage: The hero section reads “Precision Steel Fabrication Equipment for Demanding Industries.” That is fluff. No verifiable claim. The “Why Choose Us” section lists four bullet points: “Quality craftsmanship,” “On-time delivery,” “Competitive pricing,” “Industry expertise.” All fluff. The client logo bar shows twelve logos but does not name what work was done for any of them. Score: Unknown. The logos prove nothing on their own without context.
About page: “Founded in 1987.” That is a verifiable fact, but it does not support any capability claim. “We serve the automotive, aerospace, and energy sectors.” That is generic. Broad but checkable. “Our 120,000 square foot facility houses advanced equipment.” The square footage is a fact, but “advanced” is fluff. No specific machines named. Overall about page: generic.
Case studies (two of them): Case study one: “A major automotive supplier needed custom welding fixtures.” No company named. “We delivered on time and under budget.” No numbers. Score: generic. Case study two: “Midwest Auto Parts came to us with a tight timeline.” Company is named. “We completed the project in eight weeks, saving them 15% over their previous supplier.” Numbers included. Timeline documented. Score: detailed case study. This is the strongest content on the site.
Product pages: Each product page lists general capabilities: “Custom designed to your specifications.” “Available in multiple configurations.” “Precise tolerances.” All fluff or generic depending on the page. No specific tolerance numbers. No material specs. No compliance certifications named per product. Average: generic.
Blog (twenty posts): Most are general industry commentary. “Five Trends in Steel Fabrication for 2025.” “How to Choose a Fabrication Partner.” These score generic at best. Two posts include specific project details but without client names. Still generic. Average: generic.
Total content distribution for SteelTech: Third-party proof: none. Detailed case studies: roughly 5% (one case study). Generic content: roughly 70% (everything else). Fluff: roughly 20% (homepage hero, feature bullets, taglines). Unknown: roughly 5% (logo bar, certification badges without links).
The Distribution Reveals a Specificity Problem
SteelTech has a Specificity problem. Seventy percent of their content is generic enough that a machine cannot extract a citable fact from it. Twenty percent is pure fluff. They have almost no third-party proof and only one piece of content that qualifies as a detailed case study.
When an AI system evaluates SteelTech against a competitor with three named case studies, two published industry articles, and a G2 review page with twelve verified reviews, the evidence weight falls heavily on the competitor. Not because SteelTech is a worse company. Because SteelTech has not given the machine enough specific information to recommend them with confidence.
The fix is not more content. It is stronger content. Taking five of those generic blog posts and rewriting them with specific project details, named clients, and real numbers would shift the distribution significantly. Adding verification links to the certification badges clears the Unknown pile. Naming the twelve clients behind the logos, even briefly, moves that content from Unknown to detailed evidence.
Converting Unknown Content Is the Fastest Way to Improve Your Position
Score your own site using this framework. Count the content blocks in each tier. Look at the distribution. If you are above 50% in generic content and fluff, you have a Specificity problem that is actively limiting your Coverage Strength. Machines cannot recommend you on confidence if you have not given them specifics to be confident about.
The fastest way to improve your position is converting Unknown content to detailed evidence. Every certification badge without a verification link, every client logo without a project description, every award without an issuing body. These are claims sitting on your site scoring as question marks. Answering them costs almost nothing and shifts your evidence distribution more than producing new content.
The scorecard is not a judgment on your company. It is a diagnostic on your content. Treat it that way. Find the question marks. Answer them. Then look at the generic pile and ask which pieces can become detailed case studies with one specific sentence added. That is where the work starts.


Find Out What AI Tells Buyers About You
An AI visits your site and reports everything it found. Scored across six categories with machine-verifiable findings. No cost, no pitch.
Get Your Free Snapshot